Voter Turnout By County

In this map there's a bubble for each California County. The size of the bubble corresponds to the number of registered voters on the books in that county. The color corresponds to turnout. Big pale bubbles in Los Angeles and Alameda Counties have large voter populations and low turnout. Small, dark bubbles in the central and northern parts of the state vote at a high percentage, but low overall numbers.

Notes

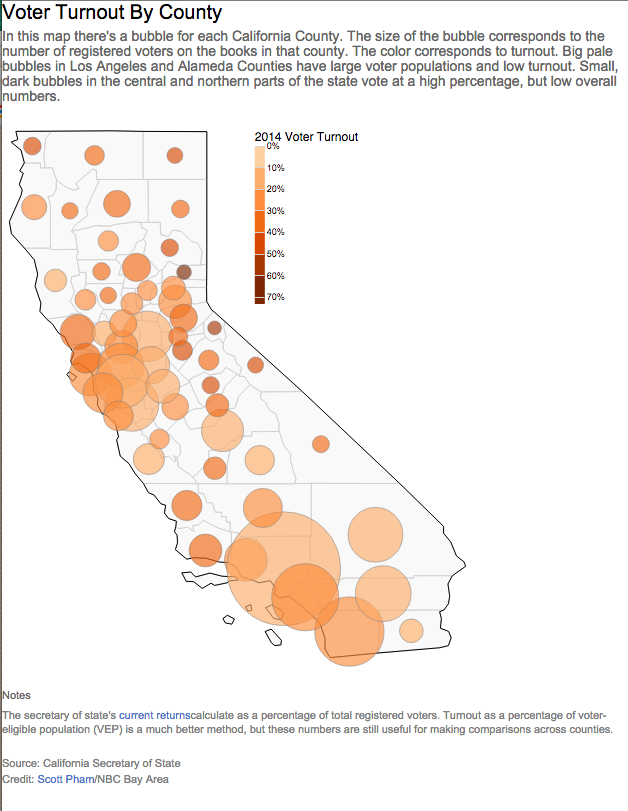
The secretary of state's current returns calculate turnout as a percentage of total registered voters. Turnout as a percentage of voter-eligible population (VEP) is a much better method, but these numbers are still useful for making comparisons across counties.